
Analytics and Reporting
Analytics and Reporting: A Comprehensive Guide from kl digital marketing agency
In the modern business landscape, data is a critical asset. Analytics and reporting are essential processes that help organizations leverage this data to make informed decisions, drive strategic initiatives, and enhance operational efficiency. This guide explores the key concepts, types, tools, and best practices in analytics and reporting.
Key Concepts in Analytics and Reporting

1. Data Collection
Gathering raw data from various sources such as sales transactions, customer feedback, website interactions, social media, and more. This step ensures you have the necessary information to analyze.
Data collection involves gathering raw data from various sources such as:
- Sales transactions
- Customer feedback
- Website interactions
- Social media platforms
- Sensor data
Data Processing
Cleaning and organizing data to ensure accuracy and consistency. This step might involve removing duplicates, correcting errors, and transforming data into a usable format.
Data processing transforms raw data into a usable format:
- Data cleaning: Removing duplicates, correcting errors
- Data transformation: Converting data into a standardized format
- Data integration: Combining data from different sources


Data Analysis
Applying statistical and computational methods to extract meaningful patterns, trends, and insights from the processed data. Techniques can range from basic descriptive statistics to advanced predictive modeling.
Data analysis applies statistical and computational methods to extract insights:
- Descriptive statistics: Summarizing data
- Exploratory data analysis: Identifying patterns and trends
- Predictive modeling: Forecasting future outcomes
Reporting
resenting the analyzed data in a clear and actionable format. Reports can be generated in various forms, such as dashboards, visualizations, summary tables, and written narratives. They should be tailored to the audience’s needs, providing relevant insights and recommendations.
Reporting presents analyzed data in a clear, actionable format:
- Dashboards: Interactive, real-time data displays
- Visualizations: Charts, graphs, and maps
- Summary tables: Concise data summaries
- Written narratives: Contextual explanations and insights
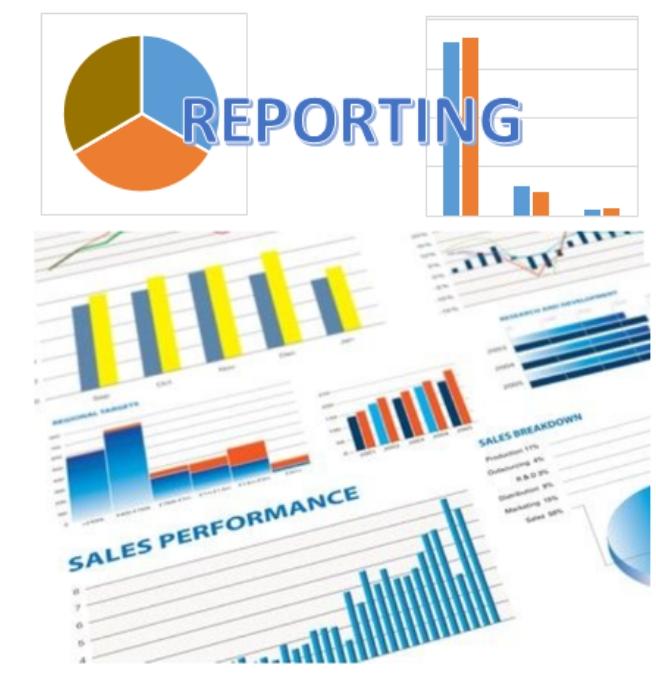
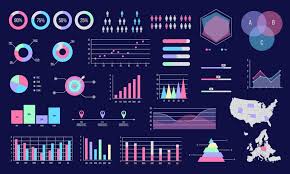
Data Visualization
Creating graphical representations of data to help stakeholders easily understand complex information. Common visualizations include charts, graphs, maps, and infographics.
Data visualization helps stakeholders understand complex information through:
- Bar charts, line graphs, and pie charts
- Heatmaps and geographic maps
- Infographics and dashboards
Type of Analytics
1. Descriptive Analytics
Descriptive analytics answers the question, “What happened?” by:
- Analyzing historical data
- Identifying trends and patterns
- Providing a clear picture of past performance
2. Diagnostic Analytics
Diagnostic analytics answers the question, “Why did it happen?” by:
- Examining the causes of past performance
- Identifying correlations and causal relationships
3. Predictive Analytics
Predictive analytics answers the question, “What is likely to happen?” by:
- Using statistical models and machine learning
- Forecasting future trends and behaviors
4. Prescriptive Analytics
Prescriptive analytics answers the question, “What should we do?” by:
- Combining predictive analytics with optimization techniques
- Recommending actions to achieve desired outcomes

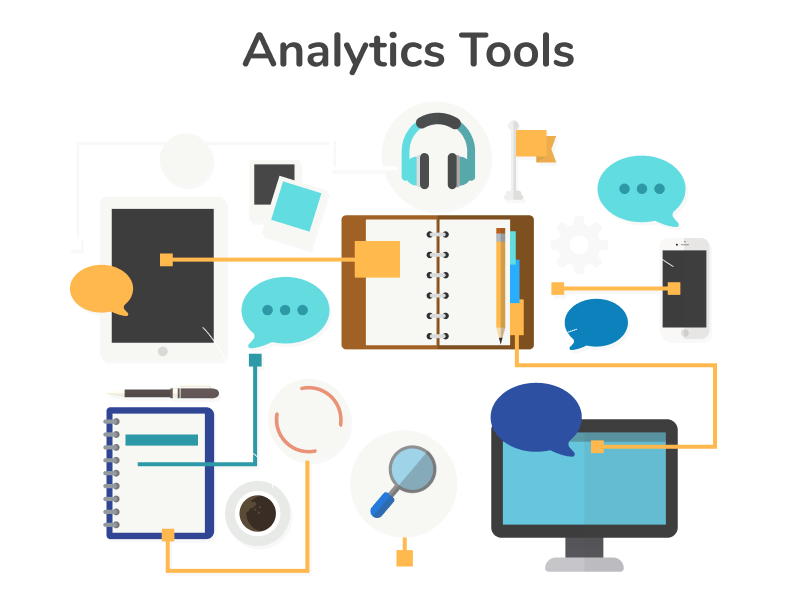
Tools and Technologies
. Business Intelligence (BI) Tools
BI tools help create interactive dashboards and reports:
- Tableau: Advanced data visualization
- Power BI: Integration with Microsoft services
- Looker: Data exploration and discovery
2. Statistical Software
Statistical software for complex data analysis includes:
- R: Comprehensive statistical analysis
- Python: Libraries such as Pandas, NumPy, SciPy
- SAS: Advanced analytics and business intelligence
3. Data Warehousing
Data warehousing stores large volumes of data for analysis:
- Amazon Redshift: Scalable data warehouse
- Google BigQuery: Serverless, highly scalable
- Snowflake: Cloud-based data warehousing
4. Data Integration Tools
Data integration tools unify data from diverse sources:
- Apache Kafka: Real-time data streaming
- Talend: Data integration and management
- Microsoft Azure Data Factory: Hybrid data integration
Best Practices
1. Define Clear Objectives
Set clear goals for your analytics and reporting efforts to guide data collection and analysis.
2. Ensure Data Quality
Regularly clean and validate data to maintain accuracy and reliability.
3. Choose the Right Metrics
Focus on key performance indicators (KPIs) that align with your business goals.
4. Tailor Reports to the Audience
Customize reports to address the
Why choose Us
Expertise and Experience
We have a proven track record of delivering successful data analytics and reporting solutions across various industries. Our team of experts leverages advanced analytics techniques to provide actionable insights that drive business growth.
Comprehensive Solutions
We offer end-to-end data analytics services, from data collection and processing to advanced analysis and reporting. Our custom-tailored solutions ensure that your unique business needs are met effectively.
Data-Driven Insights
Our approach focuses on providing clear, data-driven insights that inform strategic decisions. We use the latest tools and technologies to analyze data and present it in an easily understandable format.
Client-Centric Approach
We prioritize understanding your business goals and challenges, ensuring our services are aligned with your objectives. Our transparent communication and personalized attention guarantee a collaborative and effective partnership.
Continuous Improvement
We continuously refine our methodologies and tools based on the latest industry trends and feedback, ensuring that our solutions remain relevant and effective in driving your business forward.
Competitive Advantage
By choosing us, you gain a competitive edge through innovative analytics techniques, cost-effective solutions, and a commitment to delivering measurable results that enhance your decision-making processes and operational efficiency.